
Half my kingdom for a decent report!
We all have simple questions like:
- What’s the conversion rate across different regions?
- Which traffic sources bring the most users? And which actually convert?
- And a dozen more just like these.
Once upon a time, Google Analytics made it easy to build custom reports. But those days are gone.
Why is this a headache?
- Standard reports are a mess — tiny charts, weak comparison tools, and clunky segmentation.
- Customization is hit-or-miss — available metrics and dimensions change from one report to another.
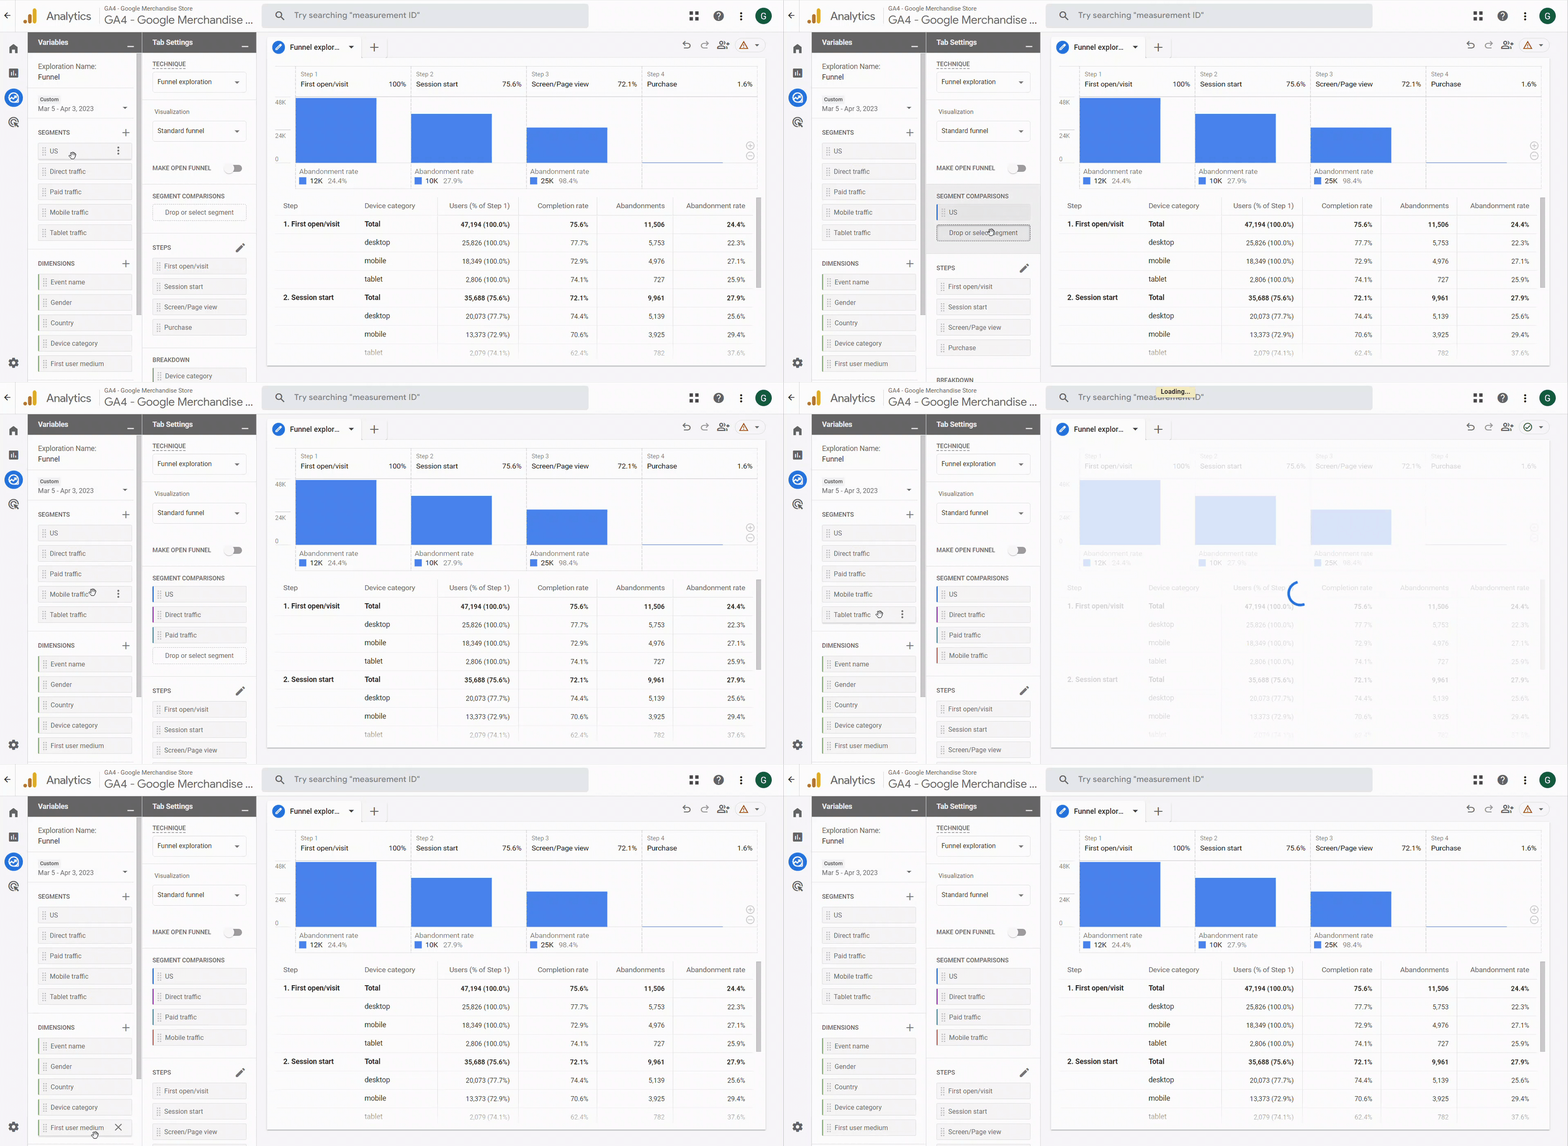
- The Explore section is better, but you can’t always save reports. So guess what? You’ll need to dig up that link every single time.
So, what’s the fix?
- Accept that GoogleAnalytics is not built for speedy reporting. For that, you need raw data.
- Get crystal clear on what you actually want to know—your questions define your report.
- Pick your weapon:
• Tweak a standard report
• Build one in Explore
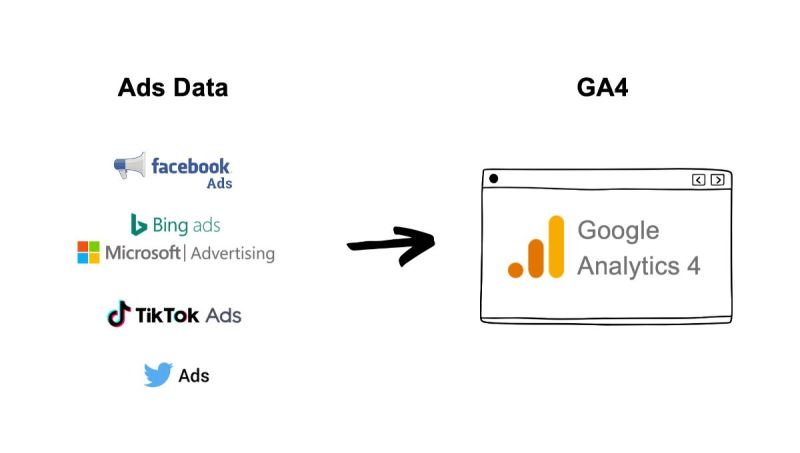
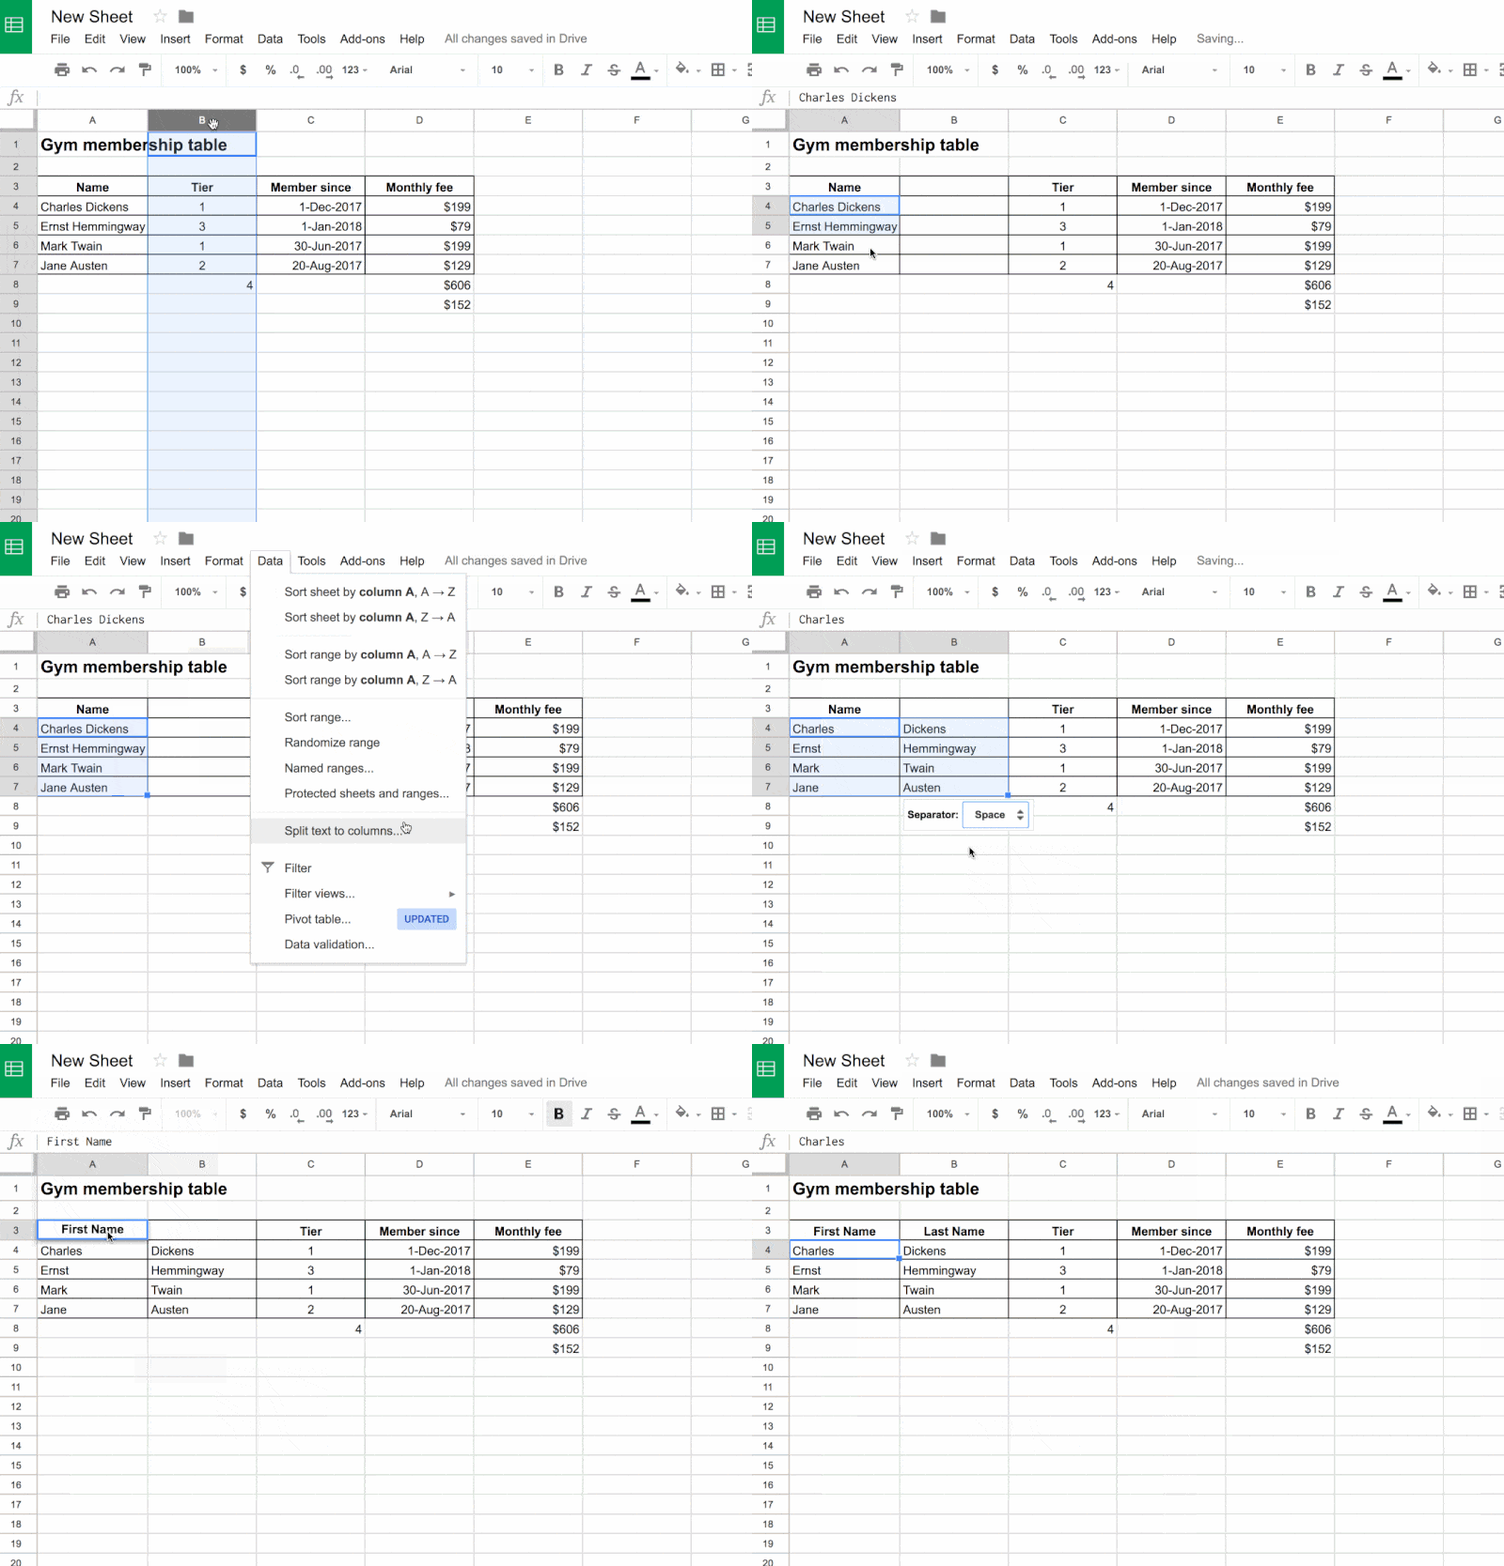
• Pull your data into Looker Studio, Google Sheets, or another tool
Bottom line:
1. If you don’t know what you’re looking for, no report will magically help.
2. GA4 reports aren’t easy, but there are workarounds—exports, Explore, or external tools.
Want a stronger data analyst role or a raise? Grab the FREE Product Analyst Playbook and get the exact roadmap to your next offer.