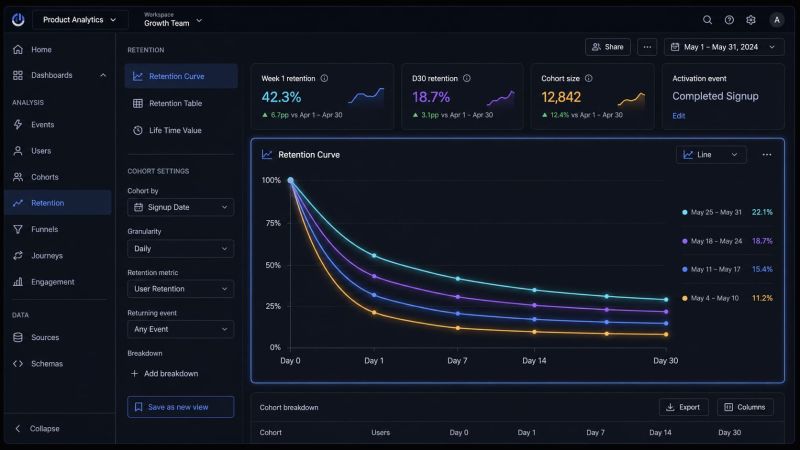
Retention looks simple from the outside.
A user came back or they didn’t.
A cohort stayed or it didn’t.
A curve went up or down.
Then you try to calculate it in a real product and everything gets messy.
Andrew Chen in his last essay has looked at thousands of retention curves over 15+ years as a founder, operator, PM and VC.
His main point is painfully practical: retention depends on the definition.
- users or accounts?
- product usage or revenue?
- D1, D7, D30 or D365?
- all signups or activated users?
- paid cohorts or organic cohorts?
- one market or several markets?
- before or after a product change?
Change the denominator and the story changes.
Change the cohort and the story changes.
Ignore seasonality and the story changes.
That is why I do not trust retention charts until I see the cohort definition.
A clean curve can still be a bad measurement system.
It can make the business look healthier than it is.
Or worse than it is.
So maybe the headline is true:
I probably don’t know retention well enough.
Want a stronger data analyst role or a raise? Grab the FREE Product Analyst Playbook and get the exact roadmap to your next offer.