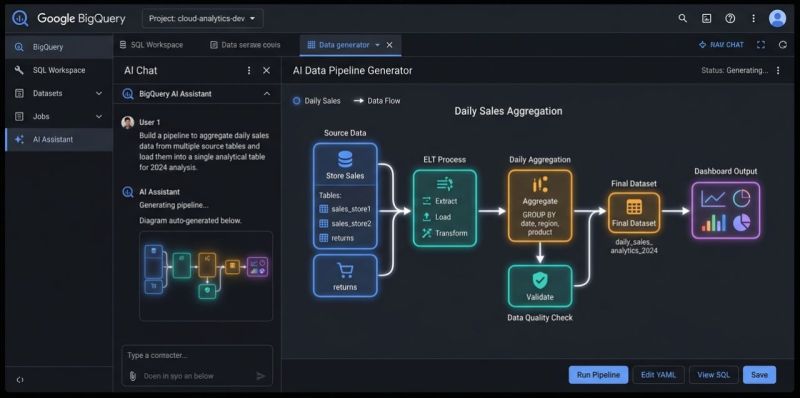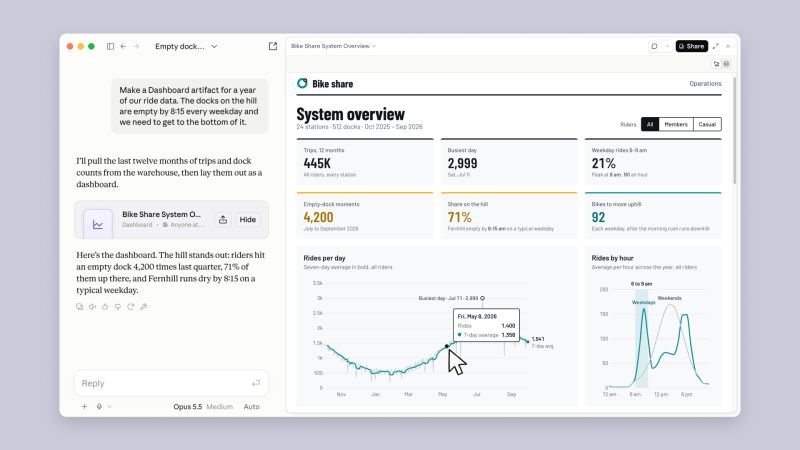
If your main pitch is “I can build dashboards and write SQL,” Claude just made that pitch harder to sell.Claude Dashboards is now available in beta on Pro, Max, Team, and Enterprise plans. Connect a warehouse such as BigQuery, Snowflake, or ClickHouse, describe what you want to understand, and Claude writes the queries and builds the dashboard.
You can ask it to:
- Show revenue by region
- Compare weekly signups across plans
- Build a view of Salesforce opportunities
- Add filters or change the time grouping
Each chart exposes its SQL query, so you can inspect how the number was calculated. Anthropic positions this as a tool for quick, exploratory analysis.
Now imagine the conversation with your next stakeholder:“We need to understand what’s happening with signups.” You start estimating the dashboard work. They open Claude. That’s the part analysts should pay attention to.
A task that used to justify a ticket, a delivery date, and several rounds of revisions can now start with a question in a chat. And once someone gets a useful first version that way, expect them to ask why the next one needs a week.
Of course, a dashboard can still count the wrong thing. Someone has to define an active customer, check whether the data is complete, and work out whether the numbers actually support the decision.
That’s where I’d be moving my skills: defining metrics, designing the data system, checking the analysis, and helping people decide what to do.
If you’re spending all your time getting faster at producing charts, try this: give Claude one of your recurring dashboard requests. Inspect the result. Then ask yourself which parts of your work still require your judgment.
Have you tried Claude Dashboards with your own data yet — or are you waiting for a stakeholder to show you first?
Want a stronger data analyst role or a raise? Grab the FREE Product Analyst Playbook and get the exact roadmap to your next offer.