Apple Ads is usually evaluated on CPI. But for subscription apps, that's almost meaningless without the full funnel: install → trial → paid → retention → LTV.
Here's what stood out from the report:
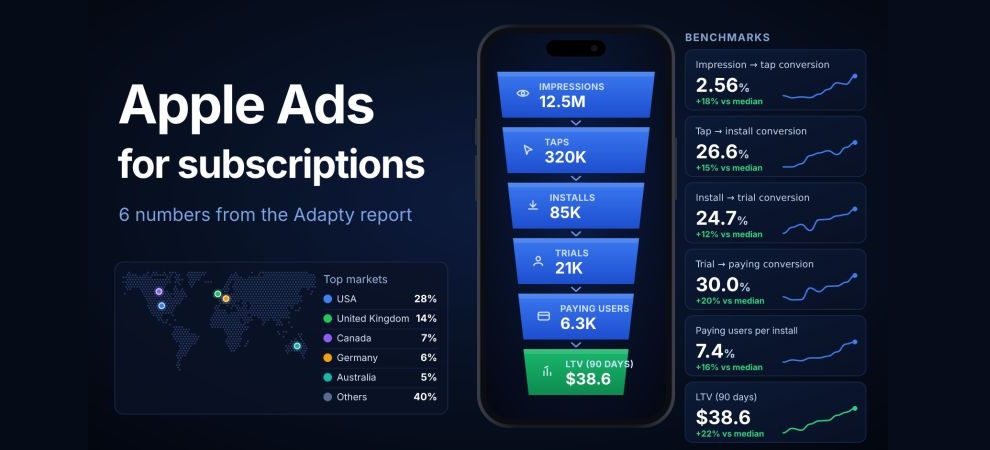
- 1M+ ad groups, 90 countries, 59 niches. This is a solid benchmark map of the market. Don't look at "average CPI" – look at your specific niche and country.
- $0.51 median CPA vs $1.34 spend-weighted CPA. The average install cost jumps significantly once you weight it by actual budgets.
- US CPA – $2.51, UK – $2.02, Australia – $1.89. Tier-1 markets are expensive. They require a strong post-install funnel: onboarding, trial, paywall.
- Median install-to-trial – 1.92%. Most installs never even reach the trial. The problem often starts right after the click.
- Custom Product Pages: +22.9% installs per impression. CPP is a fast growth lever if you're segmenting keywords and audiences by intent.
- CPT can vary by up to 14x between markets. One keyword hypothesis can be unprofitable in the US and perfectly viable in another geography.
My takeaway: Apple Ads needs to be analyzed not as an ad account, but as subscription unit economics.
Want a stronger data analyst role or a raise? Grab the FREE Product Analyst Playbook and get the exact roadmap to your next offer.