
I’ve walked into companies where the analytics stack looked impressive: endless dashboards, dozens of metrics, and KPIs for every imaginable angle. But when I asked what the team actually used to make decisions, the answer was almost always the same: two or three key numbers. The rest? Outdated, redundant, or ignored.
What’s the problem with too many metrics?
Collecting everything feels safe, but it comes at a cost:
• The business loses focus when every chart tells a different story.
• Analysts waste hours maintaining reports that no one reads.
• Outdated metrics creep in and create confusion rather than clarity.
In practice, I’ve seen teams debate for half an hour over a metric that wasn’t even connected to revenue — just because it happened to be on the dashboard.
What’s the real lesson?
Data overload creates noise. Without prioritization, metrics stop guiding decisions and start distracting from them. The solution is not “more dashboards” — it’s fewer, clearer KPIs. With a defined dictionary and reporting rules, everyone speaks the same language and the business regains focus.
When I run audits, I always recommend:
• Review all metrics with the business, not just the analytics team.
• Define a canon of reporting and a simple customer journey map.
• Cut dashboards down to the essentials.
• Introduce a process to regularly retire or update metrics.
Analytics should serve the business — not the other way around. Fewer metrics, well defined, will always beat dozens of numbers no one cares about.
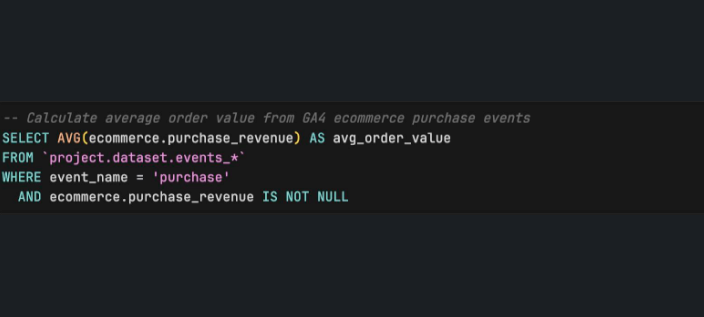
Want all my best GA4-BQ queries in one place? I turned them into a Chrome extension — top SQL queries you can search and copy in seconds.
Go here to install it for FREE.
Prefer the web version? It's here.