
In one project, GA4 and BigQuery show different numbers for users, sessions, and conversions in a single day. I’ve seen days when figures in the UI diverge from raw exports.
• GA4 counts day and sessions by its rules, while BigQuery stores raw events with exact timestamps. So the same day can look different depending on the source.
• Export delays and time zone differences add more chaos — we don’t get one day – one number.
What problems do these differences cause?
• Delayed exports mean the daily BigQuery report isn’t complete when GA4 reports are generated.
• Sampling in GA4 Explore can give averaged figures that don’t match raw exports.
• Differences in date interpretation and event structure lead to different paths and conversions, eroding trust in the data.
What can we extract?
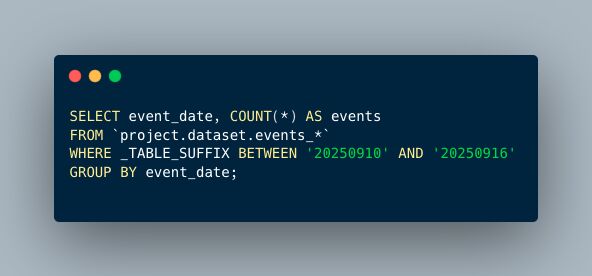
Start by looking at raw exports, not only interface aggregates. Tie data by time: compare in UTC and use explicit event_timestamp to ensure the day matches across sources.
What should we do next?
• Move timeframes to UTC, use custom_event_timestamp to bound the day.
• Check sampling and minimize its impact on key metrics.
• Build reconciliation queries in BigQuery and adjust export and analysis processes.
• Run a pilot on one channel and document the methodology for the team.
Want all my best GA4-BQ queries in one place? I turned them into a Chrome extension — top SQL queries you can search and copy in seconds.
Go here to install it for FREE.
Prefer the web version? It's here.