
Understanding how a user moved through your site requires more than a standard “last interaction” perspective. GA4’s interface simplifies journeys to the point that important details vanish. BigQuery, on the other hand, lets you reconstruct them exactly as they occurred.
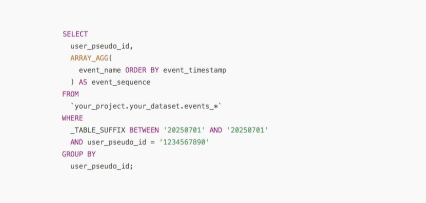
The key tool is ARRAY_AGG.
What ARRAY_AGG enables:
• Combine multiple events into an ordered list
• Rebuild a chronological chain of actions
• Review how users navigated, hesitated, or switched context
Basic workflow:
1. Select events for a specific user or cohort
2. Order them by event_timestamp
3. Use ARRAY_AGG(event_name ORDER BY event_timestamp) to generate a sequence
4. Analyze the resulting array to see the precise flow of behavior
A few things to keep in mind:
• Misaligned timestamps caused by time zone issues can distort the sequence, so unify everything into UTC
• Repeated events are common; add DISTINCT if you want a simplified list
• High-volume datasets can make full-path aggregation expensive, so consider limits or filters for large sites
Once assembled, the sequence reveals insights that interfaces never show—friction points, unexpected detours, and the exact moment users gave up or committed.
If you want to understand why a particular step kills conversions, reconstructing the journey is the most revealing place to start.
Want all my best GA4-BQ queries in one place? I turned them into a Chrome extension — top SQL queries you can search and copy in seconds.
Go here to install it for FREE.
Prefer the web version? It's here.