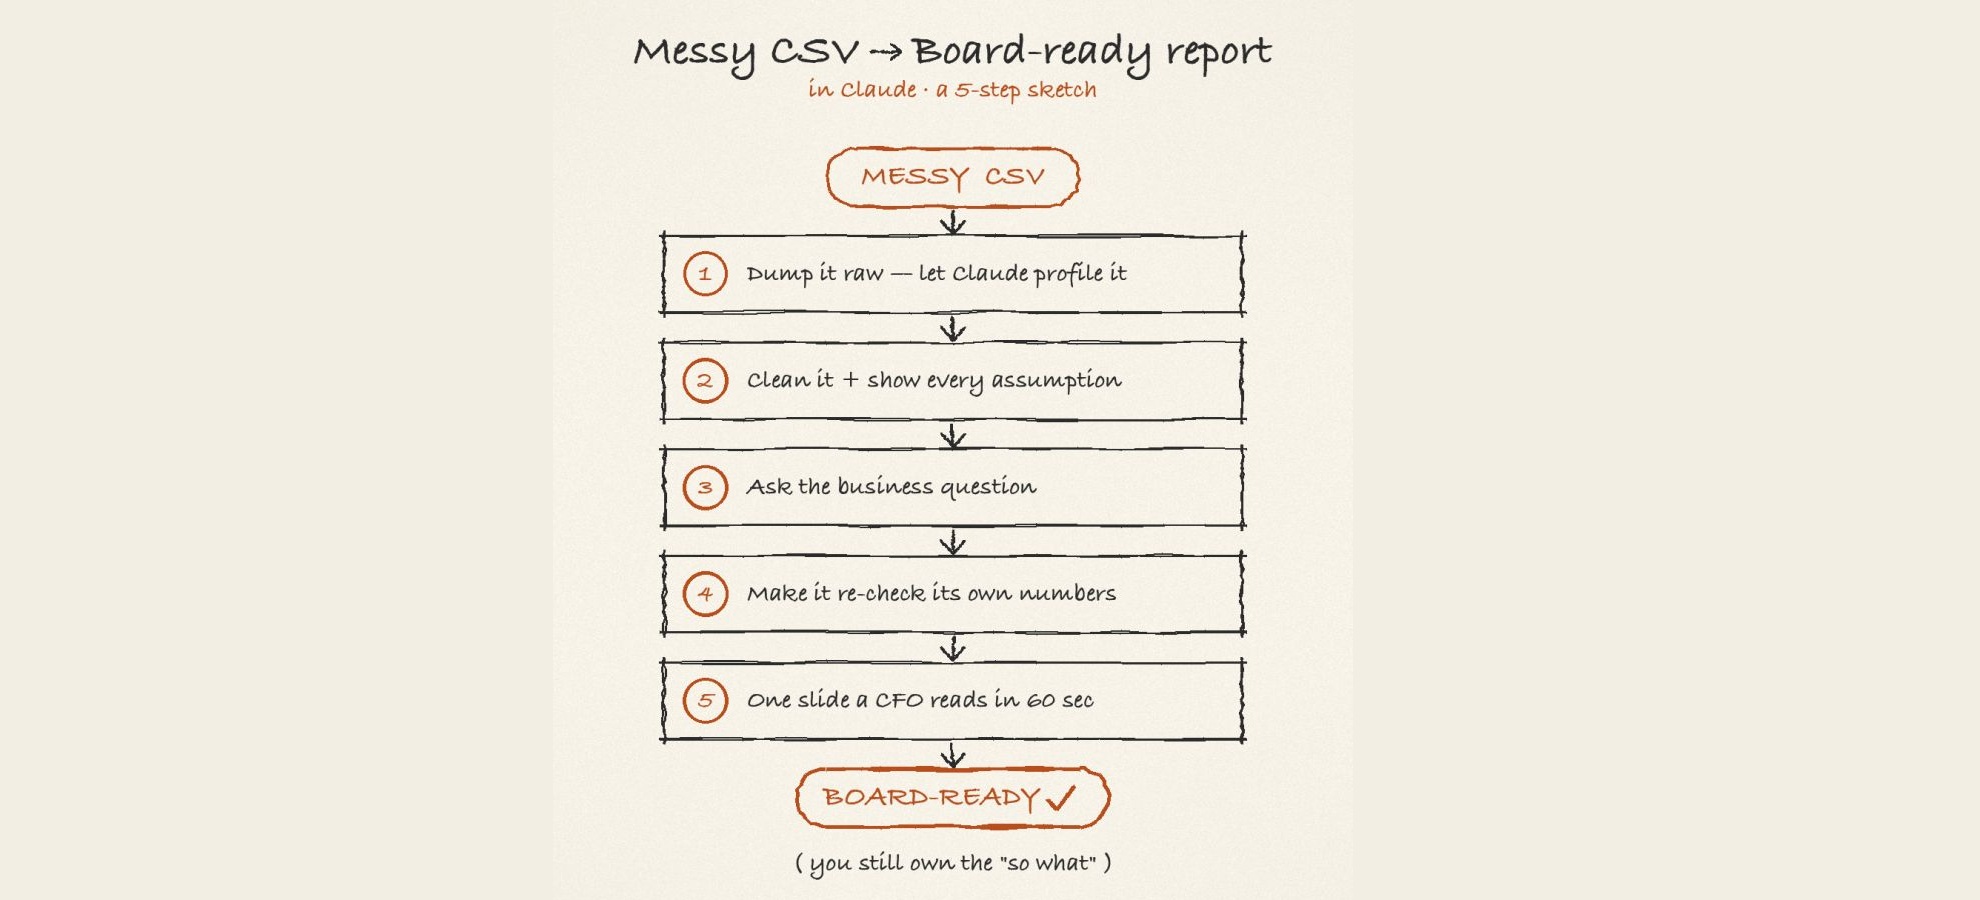
A 5-step guide for everyone who’s ever stitched exports and vibes together the night before a board meeting.
You know the one: 14 columns, three date formats, duplicate rows, a “revenue” field that’s secretly a string. And leadership wants a story by 9am.
Here’s the workflow I actually use:
- Dump it in raw. Don’t pre-clean. Upload the ugly CSV as-is and let Claude do the dirty work.
Prompt: “Here’s a raw export. Profile it: columns, data types, nulls, duplicates, anything that looks off.” - Now clean it, but make it show its work. This is the step everyone skips and later regrets.
Prompt: “Standardize the dates, dedupe rows, fix the numeric fields. Then list every assumption you made.” If you don’t see the assumptions, you don’t trust the output. - Ask the business question, not the data question. Nobody upstairs wants rows.
Prompt: “Don’t give me a table. Tell me where we’re losing revenue, what changed vs last month, and your best guess at why.” - Make it check its own numbers. AI rarely says “I don’t know”. It guesses, confidently. So force a second pass.
Prompt: “Recalculate the 3 headline numbers a different way and flag anything that doesn’t reconcile.” - Turn it into one slide a CFO can read in 60 seconds.
Prompt: “Summarize as 3 takeaways, 1 risk, 1 recommendation. Plain English, no jargon.”
That’s it. Three hours of spreadsheet wrestling → a tight, defensible report.
One caveat: Claude does the cleaning and the math. You still own the judgment. The “so what” is your job, not the model’s.
Want a stronger data analyst role or a raise? Grab the FREE Product Analyst Playbook and get the exact roadmap to your next offer.