A lot of content gets judged by last-click, and that’s why good content often looks useless.
Traffic is easy to measure. Conversions are easy to measure.
What’s hard is connecting a piece of content someone read today to a purchase that happens two or three weeks later.
So most teams fall into one of two traps:
- they stop trying to measure content properly
- or they use last-click and conclude that content “doesn’t convert”
Usually the data is already there.
In GA4, every page_view has a page_location. Every conversion has a user_pseudo_id.
So the real task is not collecting more data. It’s connecting content exposure to the pre-conversion path.
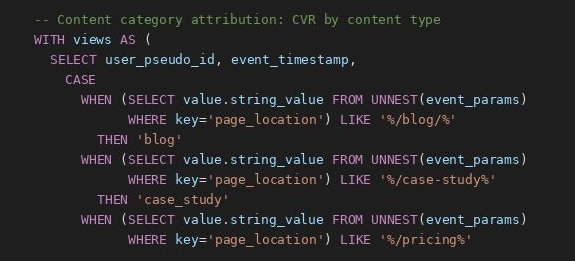
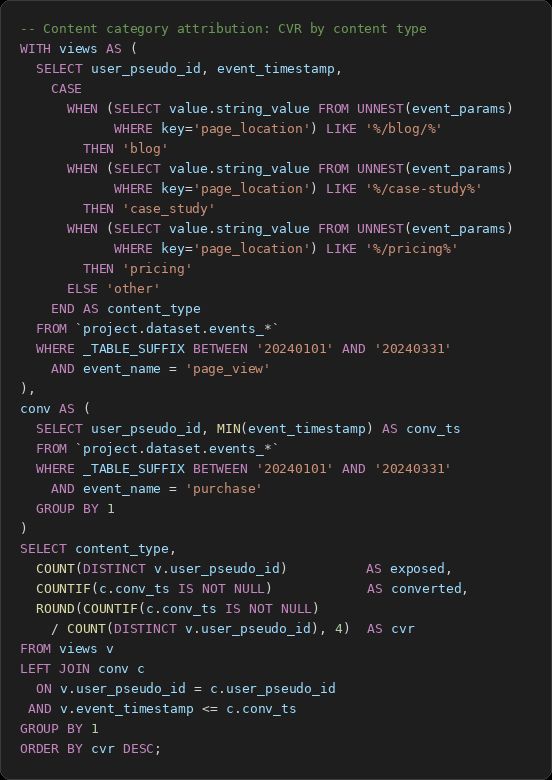
A practical way to do this in BigQuery is to measure attribution at the content category level, not at the individual page level. For example:
- classify pages by URL patterns: blog, case study, landing page, docs, webinar, and so on
- map which categories a user visited before converting
- compare converters vs non-converters across those categories
- calculate conversion rate by content type, not just page traffic
That gives you something much more useful than “this article got clicks.”
You start seeing which types of content actually show up in converting journeys.
And that leads to better decisions.
I worked on this for a SaaS client that was close to cutting their blog because it “didn’t drive conversions.” Once we looked at the path properly, the picture changed.
Users who read at least one case study converted at a much higher rate. And the blog was one of the main routes that brought people to those case studies.
So the blog was not failing. It was playing an upstream role that last-click simply ignored.
That changed the budget conversation completely.
Want a stronger data analyst role or a raise? Grab the FREE Product Analyst Playbook and get the exact roadmap to your next offer.