
Retention answers a simple question: who came back after their first visit? But in many dashboards, this turns into a blurred metric where “new” and “returning” behavior are merged and cohort logic is missing.
Common mistakes:
• counting all active users instead of tracking specific cohorts
• comparing different time frames and calling it “day 7 retention”
• ignoring the user’s true first activity date
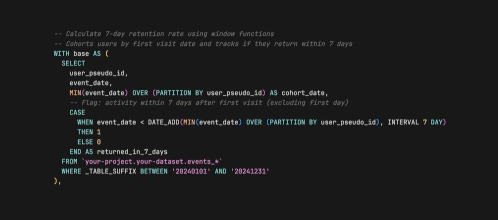
Window functions in SQL let you build retention properly.
A typical approach:
• determine each user’s first active date with something like MIN(event_date)
• treat that date as the cohort anchor
• check whether those same users return on specific days or weeks after that anchor
From there, you can calculate the share of users who reappeared on day 1, day 7, day 30, or any other interval that matters to your product.
The result is a retention curve that reflects real behavior instead of blended traffic noise - and a much clearer sense of whether your product is actually keeping the users it acquires.

Want all my best GA4-BQ queries in one place? I turned them into a Chrome extension — top SQL queries you can search and copy in seconds.
Go here to install it for FREE.
Prefer the web version? It's here.