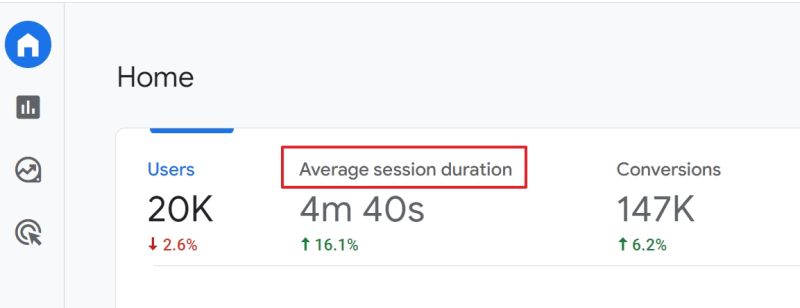

In my experience, average session duration in GA4 often looks suspiciously high. The platform automatically records engagement events — scrolls, clicks, file downloads — and calculates the time between them.
But that doesn’t always mean the user was actually active. A tab left open for half an hour can inflate “engagement” without reflecting reality.
Differences in how GA4 defines sessions and how it sprinkles in automatic events create misleading signals:
• Session time stretches even if the user walked away.
• Auto-events inflate engagement, making reports look healthier than they are.
• CRM and BI numbers paint a different picture, creating inconsistencies.
I’ve seen teams celebrate “longer sessions” while sales data showed customers dropping out much earlier.
The real takeaway
Average session duration isn’t a reliable proxy for engagement unless you normalize it. Without filtering or adjusting for auto-events, the metric can mislead more than it informs. Reports become less about how customers behave and more about how GA4 defines “activity.”
What to do instead
The approach I use with clients includes:
• Define a shared rule for what counts as a session and engagement.
• Filter or adjust automatic events so they don’t skew the data.
• Cross-check GA4 numbers with BI and CRM to validate patterns.
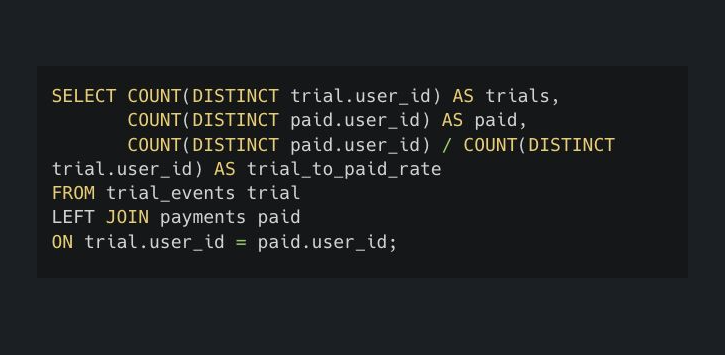
• Use BigQuery exports for precise analysis of time-based metrics.
When session duration aligns with business logic, it becomes useful. Until then, it’s just another flattering metric in the dashboard.
Want all my best GA4-BQ queries in one place? I turned them into a Chrome extension — top SQL queries you can search and copy in seconds.
Go here to install it for FREE.
Prefer the web version? It's here.